Table of Content
Introduction
This report displays information:
- about the results of the established sales plans for employees in retail outlets,
- the percentage of their actual fulfillment,
- the projected percentage of fulfillment of plans at the end of the period as of the current time.
Building a report
Report parameters
Before building the report, you will be asked to fill in the parameters.
Standard selections are not specified in the parameters.
If necessary, you can use selections to specify which data you need to build a report on.
The following parameters are available for building:
- Template selection: standard, custom.
Custom template is available if the report was previously generated and its settings were saved by the user. - The period of building the report in months.
- Building a report on a specific date within the selected month.
- Selection according to specific sales plans.
- Selection of employees.
Attention!
More selections you have specified in the parameters window, faster the report will be built.

Appearance
By default, the report is generated in the following format:

Report Attributes
| Title | Description | |
|---|---|---|
| Sales plan | Name | Name of the sales plan. |
| Description | Description of the sales plan, filled in when it is created by an office employee. | |
| Responsible | Office employee who was listed as responsible when creating the sales plan. | |
| Period from | Begin of the sales plan activity period. Outside of the activity period, data on customer shipments does not fall into this plan. | |
| Period for | End of the sales plan activity period. Outside of the activity period, data on customer shipments does not fall into this plan. | |
| Employee | Employee | Employee who participates in the specified sales plan. |
| Team | Name of the team that the employee belongs to according to the organizational structure. | |
| Supervisor | Supervisor of the employee according to the organizational structure. | |
| Outlet | Code | Code of the point of sale. |
| Name | Name of the outlet that participates in the sales plan. | |
| Address | Address of the point of sale. | |
| Chain | Chain to which the outlet belongs. | |
| Plan/fact of visits | Planned Visits | Total number of scheduled visits to the selected point of the agent for the entire period of the sales plan. |
| Fact of Planned Visits | Fact number of completed visits to retail outlets on the days of planned visits for the period of the sales plan by the date of the Report on the date. | |
| Fact of Unplanned Visits | Fact number of completed visits to retail outlets outside the days of planned visits for the period of the sales plan to the date Report on date. | |
| Planned Visits Left | Planned number of visits that an employee has left to make to a point of sale before the end of the sales plan from the date of the Report to date. | |
| Results | Plan, amount | Planned value of the sales amount for the entire period specified in the context of the plan for the point of sale for the employee. |
| Fact, amount | Fact value of the plan amount at the specified point of sale from the beginning of the sales plan on the date of the "Report on the date". | |
| Fact, % completion | Percentage of plan fulfillment at the specified point of sale is calculated on the date of the Report on the date. | |
| Forecast, amount | Estimated value of fact indicator that will be reached at the end of the sales plan period while maintaining the pace of implementation of the sales plan and the visit plan. | |
| Forecast, % completion | Calculated value of the final % of completion, which will be achieved at the end of the period while maintaining the pace of the plan. | |
Helpful Hint
Attribute Forecast, % of completion, depending on it value, is highlighted in the appropriate color.
- Red - the percentage value is less than 50%.
- Yellow - the percentage value from 50% to 89% inclusive.
- Green - the percentage value of 90%.
Thus, it is easy to see statistics on the forecast of the implementation of the plan, to identify problem areas of sale.
Report visualization
Columns configuration
Display of the information in the report is configured in the right part of the screen - on the Columns panel (1).
By clicking on the Columns button, the panel will be hidden.
You can return it by clicking again.
Columns can be configured via the context menu of the column.
You can call it by pointing the mouse pointer to the right side of the column.

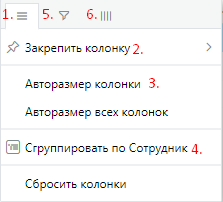
Through the context menu, you can access the following functions:
- general setting (1), including:
- position (2),
- width (3),
- grouping (4);
- filtering settings (5),
- column displays (6).
If filtering is enabled for a column, a filter icon will appear to the right of the column name.

Sorting by column (ascending or descending) is done by clicking on its name.
If sorting is enabled for a column, an arrow sign will appear next to the right of the column name indicating the type of sorting.

Grouping records
It is possible to group by columns in two ways:
- through the context menu of the column Group by... (1),
- through the Columns panel, Grouping by records block (you need to drag the column) (2).
Below the Grouping by records block is the Values block (3).
With its help, you can configure the display of data by grouped columns in the report.
They will be displayed as additional columns with the appropriate name.
A similar effect can be achieved using the context menu of the columns by clicking the Aggregate values item.

Summary
By columns with the Number data type in reports, you can display Subtotals.
To display Subtotals by column, click on the drop-down list right under the column of interest and select the mechanics of interest for counting subtotals.
Available mechanics:
Amount - output of the sum of values according to the column data.
Average - output of the average value according to the column data (zero values are involved in the calculation).
Minimum - output of the minimum value according to the column data.
Maximum - output of the maximum value according to the column data.

Additional report features
| Icon | Title | Description | Example |
|---|---|---|---|
| Customization | Return to the Report Parameters window. |
|
| Saving | Saving custom report settings. |
|
| Refreshing | Updating information in the report. |
|
| Export to Excel | Exporting information from a report in Excel format. |
|


